
Infographics
July 4 Temperatures in Our Nation’s Capital
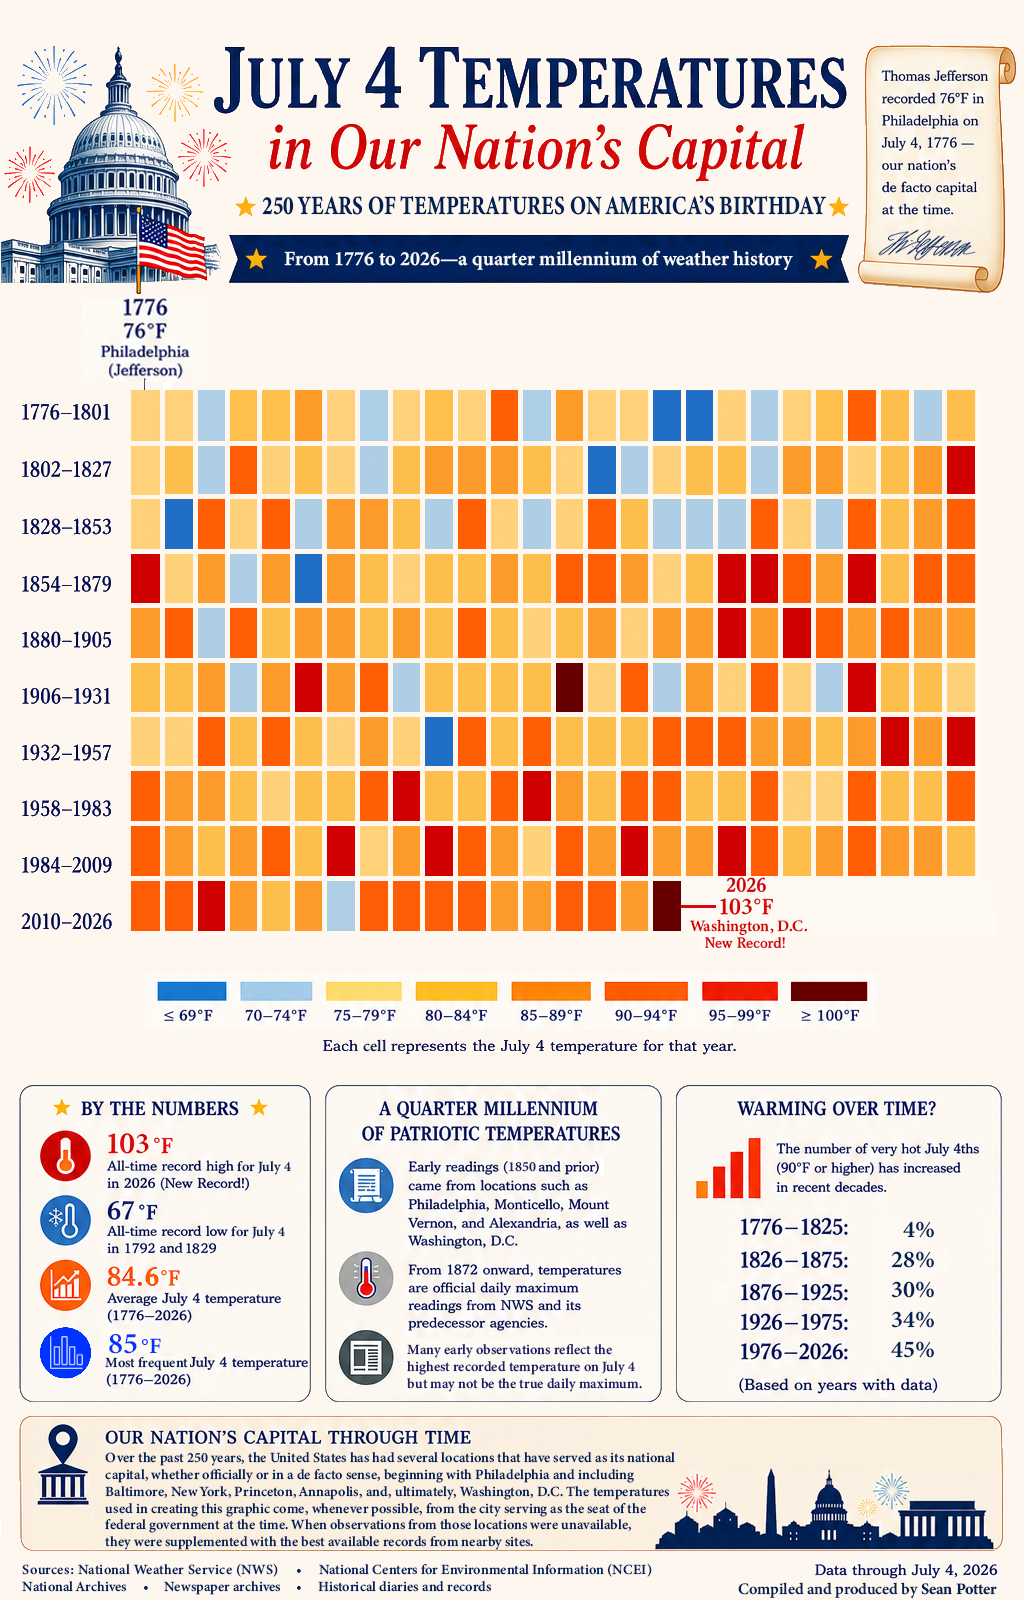
Most people are familiar with Thomas Jefferson’s famous observation of 76°F in Philadelphia on July 4, 1776, and many also know that Washington, D.C., reached a record 103°F on July 4, 2026. But what about the 250 years in between? This infographic answers that question by compiling July 4 temperature observations from historical and official sources, including the National Weather Service (NWS), National Archives, National Centers for Environmental Information (NCEI), newspaper archives, historical diaries, and other contemporary records. Because Washington did not become the nation’s permanent capital until 1800—and systematic observations there began decades later—the earliest temperatures come from the locations serving as the seat of the federal government at the time or nearby sites with the best available observations. From 1872 onward, all temperatures are official daily maximum observations for Washington, D.C., from NWS and its predecessor agencies, placing this year’s record heat into a broader historical perspective.
D-Day’s Secret Weapon
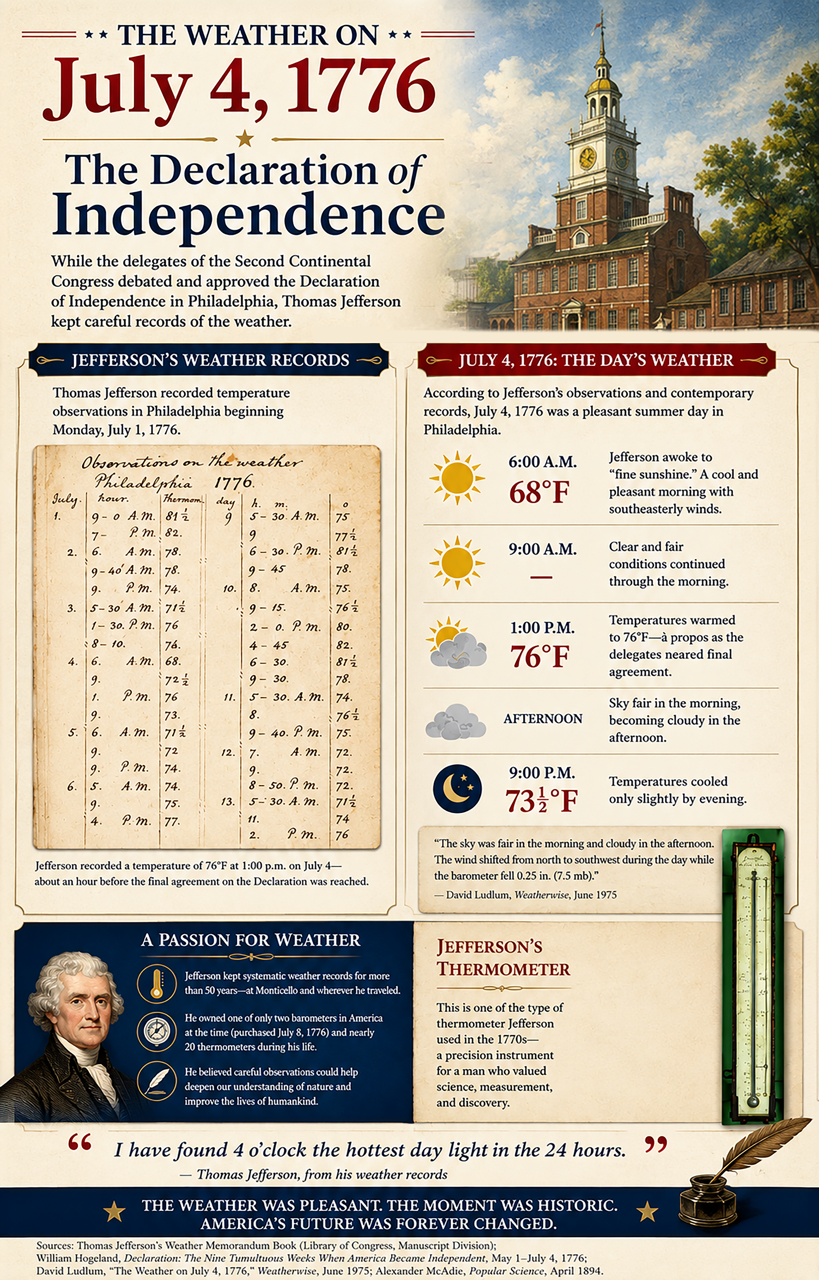
This infographic explores the weather in Philadelphia on July 4, 1776, the day the Second Continental Congress adopted the Declaration of Independence. Drawing on Thomas Jefferson's original weather memorandum book, it reconstructs the day's conditions through the temperatures and observations he recorded while serving in Congress. The infographic features Jefferson's handwritten weather log, one of his surviving thermometers, and a timeline of conditions from sunrise through evening, showing that the day began with pleasant sunshine before becoming cloudier later in the afternoon. It also highlights Jefferson's lifelong dedication to meteorological observation and scientific instrumentation, placing his July 4 records within the broader history of American weather observing. Together, these rare historical artifacts and contemporary accounts provide a unique glimpse at the atmospheric backdrop to one of the most consequential days in American history.
Most people are familiar with Thomas Jefferson’s famous observation of 76°F in Philadelphia on July 4, 1776, and many also know that Washington, D.C., reached a record 103°F on July 4, 2026. But what about the 250 years in between? This infographic answers that question by compiling July 4 temperature observations from historical and official sources, including the National Weather Service (NWS), National Archives, National Centers for Environmental Information (NCEI), newspaper archives, historical diaries, and other contemporary records. Because Washington did not become the nation’s permanent capital until 1800—and systematic observations there began decades later—the earliest temperatures come from the locations serving as the seat of the federal government at the time or nearby sites with the best available observations. From 1872 onward, all temperatures are official daily maximum observations for Washington, D.C., from NWS and its predecessor agencies, placing this year’s record heat into a broader historical perspective.
Infographics
July 4 Temperatures in Our Nation’s Capital
Most people are familiar with Thomas Jefferson’s famous observation of 76°F in Philadelphia on July 4, 1776, and many also know that Washington, D.C., reached a record 103°F on July 4, 2026. But what about the 250 years in between? This infographic answers that question by compiling July 4 temperature observations from historical and official sources, including the National Weather Service (NWS), National Archives, National Centers for Environmental Information (NCEI), newspaper archives, historical diaries, and other contemporary records. Because Washington did not become the nation’s permanent capital until 1800—and systematic observations there began decades later—the earliest temperatures come from the locations serving as the seat of the federal government at the time or nearby sites with the best available observations. From 1872 onward, all temperatures are official daily maximum observations for Washington, D.C., from NWS and its predecessor agencies, placing this year’s record heat into a broader historical perspective.
D-Day’s Secret Weapon
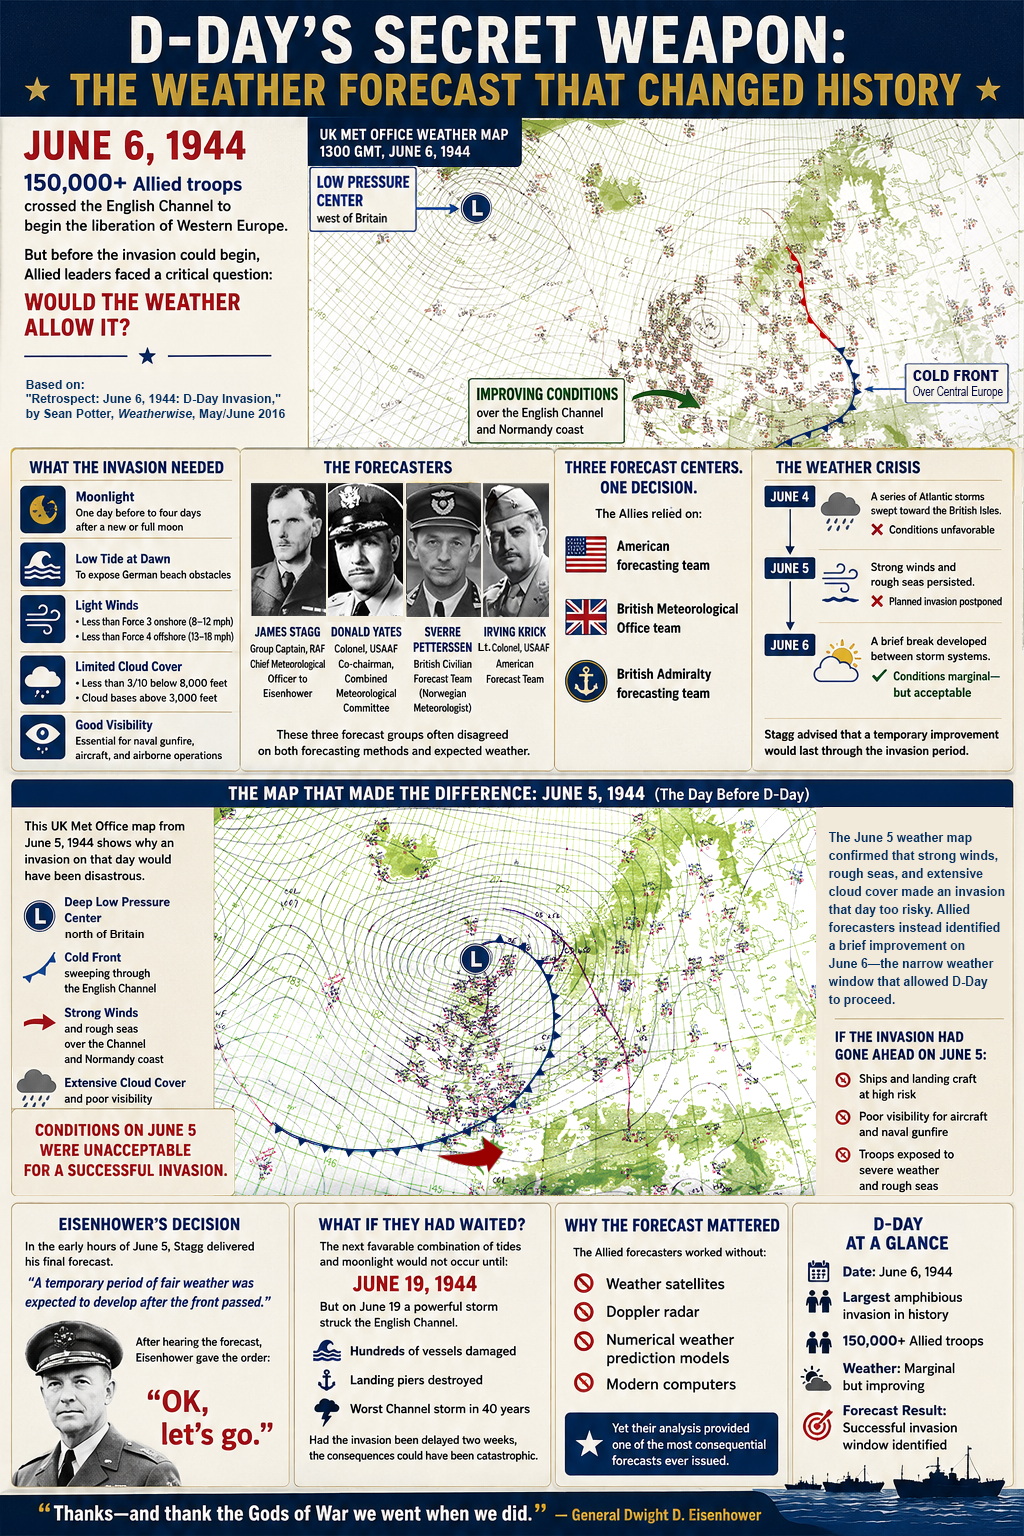
The fate of D-Day—and perhaps the course of World War II—hinged on more than military strategy. It depended on the weather. This infographic tells the story of the remarkable forecast that enabled the Allied invasion of Normandy on June 6, 1944. Featuring original UK Met Office weather maps from June 5 and June 6, it explains why the invasion was postponed, how meteorologists identified a brief period of improving conditions, and why General Dwight D. Eisenhower ultimately gave the order to proceed. It also introduces the key forecasters behind the decision, outlines the precise weather conditions required for Operation Overlord, and examines the devastating storm that struck the English Channel less than two weeks later—underscoring just how narrow the opportunity for success truly was.

D-Day’s Secret Weapon
Created in recognition of National Meteorologists Day, this infographic celebrates the science, skill, and public service of the professionals who study Earth’s atmosphere to better understand and predict weather and climate. Centered around a photorealistic meteorologist, the design uses annotated visuals, icons, and callout panels to explain the educational background, technical expertise, and advanced tools—including Doppler radar, satellites, weather stations, and supercomputers—that support modern forecasting. It also highlights the many roles meteorologists play in analyzing data, producing forecasts, conducting research, communicating hazards, and improving forecasting techniques. Additional sections showcase career opportunities across government agencies, private industry, and academia while emphasizing the profession’s broad societal impact. From protecting lives and property to supporting transportation, agriculture, energy, and emergency management, meteorologists transform complex atmospheric data into actionable information that helps communities make safer, more informed decisions every day.